Wednesday, April 30, 2008

Update on the FRE "game"

back to 24.70 at some point today where I bot the batch I used to play the covered call game at the top of the range, $27. The call was $1.50 and now $0.45, unfortunately STILL not enough to retire.

Still haven't added any more and my thinking I should at $24, as it represents $3 drop from $27. Gawd this earnings waiting game is getting longer and longer. :)

Hmm, FRE-FNM "spread" widened , now at $3.40 at the close 5/1/2008. Maybe if I add before it hits 24 (my target) I should experiment with a couple hundred shares hedged with equal # of shares (NOT equal $) FNM short. I'll think about it tonight.

More notes:

  1. Could FNM bounce back to $30 ($2 up) which is a nice pattern if it completes within this triangle - remember it's been sold "hard" and that price is clearly not out of the question given the price range lately post BSC. ($27 - 34) - data @ BSC is not admissible.
  2. On the same axis, could the spread FRE-FNM be due to a bounce as well. That one is also on a tight channel as far as I can tell.
  3. If you get $2 FNM up and $1.50 tightening on spread, would you consider 5 days of "investing" be worth $3.50/$25 = 14% return unlevered unacceptable? :D
  4. The risk? Looks to me 20c more widening and $1.00 drop more on FNM resulting in $1.20 further drop if you go naked long. That's 6% loss unlevered. Can you take that risk?
  5. Let's say I use pure random walk theory ( I know NOTHING about these stocks ), Expected gain/loss = $0. Outcome anywhere between -$1.20 and +$3.50. The skew (and fat tail, check your option premium!!) is on your side?


Will think hard again later.


Doubled positions in ...

DCI. Target still $60.

Read what happened to CMI. Clean growth story with minimal GENERIC decoupling bullshit dependency.

Will very likely do the same. The P/E on CMI had just expanded 10+% suggesting the "spread risk" equity will take is going down for the sector.

Tuesday, April 29, 2008

Very stubborn vol ...

on FRE Calls May 28s.

I was thinking it should be like 30-40c by $25.50 but now at 60c.

Not yet time to buy it back. Will buy back the call at 25-30c and then sit on my a** waiting for possibly Fed to disappoint with super harsh language before adding. If FRE tanks along with broader market because of that then I will add with the formula 200 shares every $2 down.

Getting my balls taped to my forehead at the end of this? We'll see. :)

Why do you have LBO Credit Seminar in ....

Beverly Hills?


==============================

Apollo's Black Says Markets `Well on Way' to Health (Update1)
2008-04-29 13:39 (New York)

(Adds debt backlog in third paragraph.)
By Jason Kelly
April 29 (Bloomberg) -- Apollo Management LP founder Leon
Black said investment banks have pared their backlog of debt
committed to leveraged buyouts and will resume funding deals
this year.
``We're well on our way'' to a credit-market recovery,
Black said during a panel discussion in
Beverly Hills,
California
. As more LBO debt is sold off in the next six months,
``the banks will be in business again.''

Booyah Moment.

I have been examining several facts over the weekend till now and would like to write it down just so I remember where I last stopped for thinking. This part of the blog may not relate at all to investing much more so than a rant.

I read that the properties sinking in value used to be 100 miles off the coast of California in late 2005. Then as 2006 and 2007 progressed, the the "blight" moved to 70, 50, 30, and now in early 2008, about 15 miles off the coast. Coincidentally, those are the areas that have been highest in value for a long time or at least since I can remember looking at data. It is true in general for east coast area like DC and Boston, as well. And the blight is still marching on to the coast.

Why is this important?

I think it underscores the constancy of wealth and how wealth will over time concentrates over a few select individual.

Concepts:

a. TIMING: The right time and the right place: Two identically skilled workers, depending on when they enter the work force in my field (2002 - the start of the housing bubble or 2006 - the end of the housing bubble) : one will earn $250-350k and the other $50-70k. This thing is a time-frozen fixture and unlikely to change because now the economy is deflating and hope is fleeting and money is gone. BOOYAH.

b. CHANCE: Back to the blight creepage to the coastal area: Ten people invests $1 each, one of them bought puts and scored 10 bagger while every body else loses their $1. Then the $10 guy buys everything the 9 others owned, houses, yacht, mistresses and moved to the higher priced areas. This is a very likely explanation. Investment, I should caution, is not limited to stocks, before you are skeptically closed to this idea, think about currency, fancy Real estate, bonds, and other things to invest and see whether this concept is possible. BOOYAH.

c. SYSTEMIC: There seems to me, that the current US system is like a car with massive oil leaks. Fluid (money) circulates well but keeps leaking. How? example: Money circulates to fund profitable business. BUT: What's a business if it's not profitable, so you shouldn't be proud of just satisfying the "requirement", that's the CNBC clowns saying "Look but GOOG make money" crowds. Also, everytime money flows it passes to the banks and thus friction because everytime it passes wealth is leeched out of the flow to feed the three or four trolls pushing papers in your friendly neighborhood bank, investment bank GS, or some generic assholes in wealth management unit of UBS, who the f*** knows. The point is in my opinion when the system works it a) satisfies the MINIMUM requirement to keep functioning, but b) most of the time it NO LONGER does and chooses to feed TROLLS instead. BOOYAH.

All these imbalances would over time leave 299,999,999 with nothing and 1 guy with everything. While I think over time the best scheme is "free market" and capitalistic, I look forward to some Good old Bolshevik, Tzar-executing, BOOYAH moment in USA.

Monday, April 28, 2008

Ambac was complaining ...

that someone "tricked" them into guaranteeing ABS CDO backed by Bear Stearns 2007 ABS bond.

Here's the story, would you be surprised basically it's about they got taken to the cleaner?

Douglas Renfield-Miller, an executive vice president at Ambac, said Thursday in an interview that the company's policies will pay bondholders unconditionally, even in the event of fraud.In a case where a loan is determined to have been misrepresented "then Ambac may have recourse against the issuer to repurchase that loan," he added.A bigger claim would involve an entire insurance deal that was fraudulent.

This could give Ambac a claim against the issuer for any claim payments made.Ambac's worst-performing deal covers home equity lines of credit, packaged into securities by Bear Stearns Cos. (BSC) in 2007. Over-60-day delinquencies in the underlying loans have shot up to 81% of the current balance loans in the transaction.That delinquency rate is a multiple of the average for such securities, according to a Standard and Poor's report issued Thursday.

Total delinquencies for 2007 second mortgage-backed securities that had their ratings lowered hit 11.88% in March, the ratings agency said. Individual transactions have projected ultimate losses ranging from 11.56% to 88.36%.A Bear Stearns spokesman did not immediately return a phone call asking for comment.

"Financial guarantors did not sign up for the fraud that appears to have been rampant in the mortgage market," Ambac said in an emailed response to questions Friday. "As our positions continue to develop in this area, any assumptions about recoveries will be built into our loss reserving against particular transactions. Hopefully, our efforts will also prevent some deals from becoming impaired in the first place."

So I figure what the heck, maybe I take a gander what it is just for shitkicking fun:

Nine months old mortgages!! 92% refinance, and most of those managed to even cash out $$$ during the credit crunch in 2007. Kudos to BSC, the hero of little subprime midgets. (Hmm, Just occured to me, this is what avoiding reset through refi would look like, eeeekkk ... )


How was the deal supposed to perform? (For the BBB bond of that deal which was backing the CDO Ambac was complaining about)

Well, do you prefer Libor minus 15,000 or Libor minus 24,000? By that yield, does it mean the whole thing is wiped out in 3 and a half weeks or four? WTF.

Do-Re-Mi as in Downey Financials (DSL) SHORT COVERING.


Do-re-mi-fa-so-la-ti-Do!!!!!


Hit the keys certain way and that's what you will hear. Which is why I expect a RATHER MASSIVE short squeeze in Downey Financials.

All the RIGHT notes have been hit.

Do: DSL is still paying dividend;
Downey Financial Corp. canceled its plan to suspend its quarterly dividend Friday, saying instead that the payout would be sharply reduced, citing its steep losses on the slumping California housing market.

Re: Modifications everywhere and likely to be a keyword. BAC is releasing super big news about not foreclosing people and modifying loans: (BN) *BANK OF AMERICA COMBINED SEES MODIFY AT LEAST $40B IN...

Mi: Even the bankrupt Mortgage insurers are "submitting plans" allegedly to stay solvent:
April 28 (Bloomberg) -- Radian Group Inc., the third-largest
U.S. mortgage insurer, submitted a plan to Freddie Mac and Fannie
Mae to restore the rating of its claims-paying ability.
Raising its rating to AA ``will be a long-term endeavor,'' Philadelphia-based Radian said today in a statement distributed by PR Newswire.

Fa: GSE is "promising to help" CA jumbos Buy Buy Buy: McLean, VA – Freddie Mac (NYSE: FRE) has agreed to purchase billions of dollars of new conforming jumbo mortgages with original loan amounts up to $729,750 from Wells Fargo Home Mortgage, Chase, CitiMortgage and WaMu. Freddie Mac conforming jumbo mortgages can be used to finance properties in hundreds of high cost markets designated in the Economic Stimulus Act of 2008 President Bush signed on February 13.

Based on the above, there should be a sizeable short covering in DSL, especially with First Fed reporting on April 30. (They tend to "beat" the forecast). No matter how bad the fundamental and how likely DSL is going to go broke by Jan 2009 (my calculation is 100% sure they are dead), I am calling for a 25-35% rally to $18-20 range from here.

The short seller in DSL has been far too complacent. They need to be punished, and punished hard they will be.

Conviction Buy added:

1. DCI (Donaldson)

Bot last week at $42s. Target was low $50s in three months, but I am upping it now to $60.

Why? This thing works like clockwork, that's how clean it is.


2. Thinking hard about doubling my DHR position in the "trading" portfolio.
3. FRE covered trade is beginning to be profitable. The call is decaying 20% in value since Friday. Once it dropped 80% I will cancel it (if underlying goes to $25.50), double the trading position and position LONG going into FNM and FRE earnings, tentatively speaking. By that I am evaluating fundamental and news flow DAILY.

Friday, April 25, 2008

Mortgage Technical Day: April 25th

Remittances (payment information) on mortgages are released every 25th of each month. So today I looked up the ABX 2006-2 remittances.

Here is some eyeballing statistics that I will use from March-April data:

Remaining Unpaid Balance: 60%
Increase in cumulative loss: 0.40% off the Original Balance.
Paydown Speed as a rate vs. Remaining Unpaid Balance (including default) : 24% CPR
Severity: 40%.

I want to deduce nationwide, for the subprime borrowers accross USA, how many were able to refinance and how many ended up in default.

That is, how much of the 24% Paydown speed that is due to defaulted, liquidated homes?

Well that's easy:

Defaulted balance must have been (Increase in cumulative loss divided by Severity), which is 1% in a MONTH off the Original balance.

Therefore, as a fraction of the current balance it is 1% / 60% = 1.67% per month went default. Or in annualized rate, it is 1.67% x 12 = 20% rate annual of liquidation of Current Unpaid balance.

There you have it, off the 24% Subprime paydown rate that occured in March 2008,

  • about 20% of that is involuntary, homes being liquidated and people being kicked out of their homes.
  • Only 4% of that rate was able to refinance.
Expect mortgage technical on the 25th of each month.

Oh before I go, on the Prime mortgage side, I read that
  • Freddie Mac serious delinquency is now 74 bps versus 71 bps a month ago?
  • And Fannie Mae is now 110 bps versus 104 bps last month.
The steady grind continues. ( Have you sold the call by the way against your long from 2 days ago? [grin] )

One last thing: more GS employee betting the top in their company fortune? Again, you be the judge.

Goldman Mortgage Trading Chief Sparks to Leave, Spokesman Says
2008-04-25 15:08 (New York)

By Christine Harper
April 25 (Bloomberg) -- Dan Sparks, who runs Goldman Sachs
Group Inc.'s mortgage division
, is leaving the firm after a
successful bet on the declining value of subprime home-loans
helped the company produce record earnings last year.

Real Growth down, Paper Growth UP.

April Consumer Confidence is revised down. Big deal, I am the hedge fund guru with unlimited access to capital. Fine, go buy some more DSL stocks. :D

Anyway, back to serious business, look at the way expectation is shaping up regarding inflation in the US. Was shaping up to 20 bps increase from March to April (preliminary) and now up to 30 bps increase from March to April (final). By the way look at the 5-year ahead #s as this is better to gauge TIPs reaction to it.

The 1-yr inflation expectation number is VERY hot, up 50 bps.

Also I don't believe that the Treasury bonds, as of Thursday May 24, 2008, reflected even the preliminary #s as they are of course reacting than anticipating for a couple of months now.

I really don't believe the debate about "more insurance for "further winter chill" versus the conflagration actually happening will dominate the next Fed meeting. It shouldn't in any case.


Thursday, April 24, 2008

minor update

one thing I hate about telling what to do is the "obligation" to monitor the health of the trade.

Put a stop at 25.90 or sell call at May 27 on the FRE u bought yesterday. The party is too far too fast for the minuscule news content we got today. Either add more naked stock if things drop $3 to $23 range or just cover the call by then. If it goes up, well, mission accomplished.

Focus on spare change allocator #3, the SRS covered call. The implied vol is way higher than the realized vol in the last few days given the amount of attention this thing must be getting. The bears are in shock and the bull are starting to sweat - not believeing they last this long. Premium will go through the roof as things fall a bit more ( like $5 from here ). A synthetic high yield bond can be created by having SRS covered call position. Who says u need to be a Hedge fund LLC bullshit to get leverage, huh?

More Minsky interpretation from Pimco guy.

Read the full text here:

http://www.pimco.com/LeftNav/Featured+Market+Commentary/FF/2008/Global+Central+Bank+Focus+4-08+Credit+Markets+and+the+Real+Economy.htm

My commentaries and excerpt from it:

Along the way, policy makers have slowly recognized the Minsky Moment followed by the unfolding Reverse Minsky Journey. But I want to emphasize “slowly,” as policy makers, collectively, still suffer from more than a thermos full of denial. Part of the reason is human nature: to acknowledge a Reverse Minsky Journey, it is first necessary to acknowledge a preceding Forward Minsky Journey – a bubble in asset and debt prices – as the marginal unit of debt creation morphed from Hedge to Speculative to Ponzi.

Funny to note that Greenspan is now in Pimco's payroll and his work-mate McCulley has a free-hand to slap him in the face, and there's nothing Greenspan can say about it.

And it was all quite dandy while asset prices, notably property prices, were soaring. Which, of course, propelled the Forward Minsky Journey. There were no regulatory cops on the beat, only regulatory czars in corner offices, actively accommodating growth in the shadow banking system.

Guilty.

Accordingly, regulatory arrangements need to be brought into sync with reality. I don’t profess to have a detailed regulatory reform plan ready to present you. I don’t. What I’m laying out is simply a bedrock principle: if you have access to the Fed’s discount window, the Fed should – and will, I strongly believe – have the power to supervise and regulate your business – core capital requirements, risk management, liquidity management, et al.

To be sure, there is the pesky little problem of investment bank holding companies that don’t own a bank and don’t have deposits against which they must hold reserves at the Fed. But to me, that’s not an insurmountable problem: The Fed could simply impose reserve requirements on some bucket of short-term, non-deposit funding instruments used by both investment and commercial banks (so as to keep the playing field level).


Who? GS, MS, LEH, C, JPM. What? Leverage reduction. When? Soon.

Wednesday, April 23, 2008

Some trade ideas with "decent" conviction level.

U want long "asian" ideas with fundamentals AND minimal "decoupling" dependency or any of the commodity monkey balls trade.

Longer term trade:

  • Long DHR - impressive growth in asia (NOT growth INDEXED to asian growth thesis - the decoupling people's idea) and niche medical equipments, good moat. Current $75, my target $90 in 3 months.
  • Long IF - Indonesia Fund. 10% discount to holding. Very correlated to China. Risk is if food riot escalate out of control. Current $10, my target is $12 in a month with a stop at $9.30.
  • Long JNJ - No target, chinese can't compete with these brands. To graduate to upper class there need JNJ product in household. Chinese will also discover KY-jelly is also a must in any household.
  • Long BRK/B. The guy is travelling again, to Europe. The last time he travelled around the stock did an impressive nearly 50% gain. (last year). Don't miss the boat.
  • Long SMN. These are double-inverse basic materials company. The cost is inflation in raw materials and labor. Check out AA and DD, tell me what you think. No time target.
  • Short DSL and FED at ANY price.
  • Direct short GS and DONT blink. ABS head trader has quit and this should tell you something about what's the level 3 assets look like. Hint: http://mtgspy.blogspot.com/2008/04/finished-reading-asset-level.html

Spare change allocator:

  • Buy FXI calls $10 out of the money, short term.
  • Buy 200 FRE every $3 down with NO stop loss.
  • Experiment with covered calls in SRS.
  • Experiment with market timing in SKF.

Note on the long SMN:

  • zero profit margin for industry + general anxiety + $3 gas when SMN @ $40,
  • collapsed airline/transportation + negative margin on general industry + food riots + $4 gas when SMN @$30.
  • would you like a ring-side seat with me when SMN hits $20? Yeah, I knew you would.

Tuesday, April 22, 2008

Decomposing Decoupling Theory

I may have to revisit this tomorrow after my weekly meeting at the trade floor, because I feel really sleepy right now. I may even bypass this later and write something else as my mind is not that coherent right now.

dW = (DW/DU) x dU + (DW/DC) x dC + 2 x DW^2/ (DU x DC) x dUdC + ( higher order impossible I think, the shape has to be "convex")

More notes added (04/24/2008): some people at work - from country C - "insisted" that D2W/DC2 is NOT NEGLIGIBLE when C relative size to the world is still rather small (5%). However, I am keeping this simple for now even if their argument has validity. Besides, they were rather silent when I told them that whatever the amount D2W/DC2 is, that amount is TIME-DEPENDENT. That means after a massive expansion of both U and C, the graph below shifted to the left at least "temporarily", making the D2W/DC2 term negligible in the SHORT RUN. That is as far as I am willing to concede. But thank you for the critique, it certainly is very valid.


if we assume:

W = U + C

then from taylor rule:

dW = dU + dC + 2 x [DW^2/ (DU x DC)] x dUdC + "HigherOrderTerm"

dW/dt = dU/dt (#1) + dC/dt (#2) + X (#3) (units shall be in US$)
[rate of change from "InteractionTerm" - to be called "X" from now]

Note again: Time to spell it out to add more clarity to the discussion
(1) dU/dt = Rate of change in USA GDP
(2) dC/dt = Rate of change in China GDP
(3) 2 x [DW^2/ (DU x DC)] x dUdC , or affectionately known as "X", the rate of change of World GDP as a reasult of USA/China trade.
HigherOrderTerm contains what I show as impossible, given the chart I posted relating W with its "Letter" components.

I 'll be back later when I have time but something tells me no matter what #2 is, #1 is gonna suck donkey d*** and #3 (X) is already negative as we speak, or less positive if you think it WAS positive before 2007. Decoupling condition is dW/dt > 0 and I really don't see how despite the ceaseless news claiming such to be a fact.

Unless d2W/dC2 that was part of the ignored terms were in fact important, but does that say the more C goods produced in sweatshops the more demand of it outside of C?

Or is it possible that a frictionless economy occur such that, like perpetual machine the C industry grows as rapidly because productivity goes to infinity and internal consumption likewise?

Or was it that I ignored half the rest of the planet?!!

W = U+C is really U + C + (E + J) + A

But A is really small ( U is $13.5T and A is like $350B).

How about E + J? Well it's actually bigger than A, but when you are concerned with changes over time isn't d(E+J)/dt = 0 or close enough - thus will drop out eventually for these "retirement communities"? [evil grin]

The only cross term that seems positive for 2008 - 2009 is that of C and A. But C is $3.5T and A is one-tenth of that, and the rate of change of the trade between the two is negligible with respect to rate of change of W.

So, the math doesn't seem to work out. I'll rest for now, but the case is still open. I want to spend sometime to get to the bottom of this even if the answer looks VERY obvious just from the #s alone.

-------

Okay, some more notes from a couple of question this morning.

A = GDP of Arab
C = GDP of China
E = GDP of Europe
J = GDP of Japan
U = GDP of USA.
W = World GDP

STUNNING DEFAULT NOTICE STATISTICS!!! MUST READ!

You can read the article yourself. My job as a blogger is to give you a perspective as to how large this crap is.

First consider these two statements both from March 22, 2008:

1. Lending institutions sent homeowners 113,676 default notices during the January-to-March period (First quarter). See Exhibit A.

2. Per this morning's EXISTING home sales, the WEST region is selling at a speed of 940,000 homes a year. Or about 235,000 homes per quarter. See Exhibit B.


Both are HARD data, and NOT modeled/assumed in any way.

Let's further say that CA is roughly HALF the West Region in terms of sales, and therefore CA share of the 235,000 sales is about 117,000 home sales.

Do you see the connection, or possible issue that is about to force reality down the throat of most Californians?

CA have:
a. 113,676 default notices in Q1 2008.
b. 117,000 home sales in Q1 2008.


Default Notices are running at 97% of Home Sales in CA!!!!


================================
EXHIBIT A:
CALIFORNIA FORECLOSURES REACH HIGHEST LEVEL IN MORE THAN 15 YRS
2008-04-22 13:08 (New York)


Another Jump in California Foreclosure Activity

La Jolla, CA.----The number of California homes going into
foreclosure jumped last quarter to its highest level in more than 15
years, as the market continued to works its way through declining
home values and a pool of at-risk mortgages that were originated in
2005 and 2006, a real estate information service reported.
Lending institutions sent homeowners 113,676 default notices
during the January-to-March period. That was up by 39.4 percent from
81,550 the previous quarter, and up 143.1 percent from 46,760 for
first-quarter 2007, according to DataQuick Information Systems.
Last quarter's number of defaults was the highest in
DataQuick's statistics, which go back to 1992.

"The main factor behind this foreclosure surge remains the
decline in home values. Additionally, a lot of the 'loans-gone-wild'
activity happened in late 2005 and 2006 and that's working its way
through the system. The big 'if' right now is whether or not the
economy is in recession. If it is, the foreclosure problem could
spread beyond the current categories of dicey mortgages, and into
mainstream home loans," said Marshall Prentice, DataQuick's
president.

Exhibit B: Existing home sales data March 22, 2008

By Kristy Scheuble
April 22 (Bloomberg) -- Following is a regional breakdown of U.S.
existing home sales from the National Association of Realtors.
================================================================================
March Feb. Jan. Dec. Nov. Oct. Sept.
2008 2008 2008 2007 2007 2007 2007
================================================================================
---------Seasonally Adjusted Annual Rate (Millions)--------
Total sales 4.930 5.030 4.890 4.910 5.020 5.060 5.110
Northeast 0.910 0.890 0.800 0.840 0.890 0.920 0.910
Midwest 1.160 1.240 1.210 1.160 1.190 1.210 1.220
South 1.920 1.990 1.950 1.960 1.990 2.050 2.060
West 0.940 0.920 0.930 0.950 0.950 0.880 0.930
--------------------------------------------------------------------------------
Available for sale 4.058 4.018 4.160 3.974 4.217 4.433 4.370
Months supply 9.9 9.6 10.2 9.7 10.1 10.5
10.3

More HOTNESS (2 hours later)

First, compare the chart 2 hours ago (previous post) and now:


Then read this article, I think there's a full blown panic in DC right now:

==========================

By Bo Nielsen and Ye Xie

April 22 (Bloomberg) -- The euro surpassed $1.60 for the
first time as European Central Bank officials said they'll
increase interest rates if inflation doesn't slow.


The dollar weakened for a second straight day as oil surged
above $119 a barrel and Federal Reserve Bank of Dallas President
Richard Fisher said inflation is starting to grip U.S.
consumers. South Africa's rand appreciated against all of the
major currencies on bets rising consumer prices will force the
central bank to increase its target lending rate.

``The market has started to price in the possibility of a
rate hike from the ECB,'' said Tom Fitzpatrick, global head of
currency strategy at Citigroup Global Markets Inc. in New York.
``Given the momentum of this trade, we will at least move up to
$1.6350.''


The euro advanced 0.4 percent to $1.5982 at 2:27 p.m. in
New York, from $1.5912 yesterday. It touched $1.6019, the
highest since Europe's currency debuted in 1999. The euro traded
at 164.63 yen, compared with 164.32. The dollar dropped 0.3
percent to 103.02 yen, from 103.27.

The 15-nation currency strengthened against the dollar as
ECB governing council member Christian Noyer said policy makers
will act to restrain consumer prices if inflation doesn't slow.
``Our big problem is to make sure that inflation falls back
below 2 percent next year,'' the Bank of France governor said
today in an interview on RTL radio. ``We'll do what it takes for
that,'' he said, adding, ``If needed, we'll move rates.''
Garganas on Inflation

His colleague, Bank of Greece Governor Nicholas Garganas,
said at a news conference in Athens that inflation will ``remain
high'' in the coming months and isn't expected to fall at a
``rapid pace'' in the second half.
The euro has surged 1.4 percent in April and 9.7 percent
this year against the dollar on speculation inflation will
encourage the ECB to hold its target lending rate at a six-year
high of 4 percent. A European Union report showed last week that
annual inflation rose to a 16-year high of 3.6 percent in March.
``ECB worries about inflation are over and above their
concerns about the euro,'' said Nick Bennenbroek, head of
currency research in New York at Wells Fargo & Co. `That's the
most important driver of the euro.''

The euro may rise to $1.65 over the next week after
breaching $1.60, said Greg Anderson, a foreign exchange
strategist at ABN Amro Bank NV in Chicago in a note to clients
today. Breaks of $1.30, $1.40 and $1.50 all led to increases of
about 3 cents in about a week, Anderson said.


Three-Month Euribor

The implied yield of the three-month Euribor future for
December rose 0.15 percentage point to 4.62 percent. It has
risen 0.63 percentage point this month as traders priced in the
likelihood of an interest rate increase. The ECB has held its
target lending rate steady since June.
The U.S. central bank has lowered the fed funds target by 3
percentage points since September to 2.25 percent to prevent the
economy from tipping into a recession. Futures on the Chicago
Board of Trade show an 84 percent chance that the Fed will cut
its benchmark by a quarter-percentage point on April 30. The
balance of bets is for no reduction.

A decline in European bonds after Noyer's comments widened
the yield advantage of two-year German government bunds over
Treasuries with similar maturities by 0.12 percentage point to
1.74 percentage points. The increased spread boosted the appeal
of euro-denominated assets.

The dollar's weakness hurts earnings at companies such as
Toulouse, France-based Airbus SAS when revenue from dollar-
denominated sales is converted into euros. The world's biggest
maker of commercial aircraft said it's raising the price of its
planes in response to the dollar's decline and an increase in
the cost of metals.

Stronger Rand

South Africa's rand rose 2.5 percent against the South
Korean won and 2 percent versus the dollar on bets inflation
will force the central bank to raise borrowing costs, increasing
the currency's interest-rate advantage.

The Pretoria-based central bank raised its lending target
for a fifth time in 10 months on April 10, lifting it a half-
percentage point to a five-year high of 11.5 percent.
The dollar extended its drop against the euro after a U.S.
industry report showed sales of previously owned homes fell in
March. Purchases dropped 2 percent to an annual rate of 4.93
million, from 5.03 million in February, the National Association
of Realtors said today in Washington.


The Dallas Fed's Fisher said yesterday in a Fox Business
Network interview airing today that inflation from rising food
and energy prices has been so persistent that it's starting to
affect consumers' expectations for future prices.

``I'm concerned that we might be on a path of higher
inflation than we would otherwise have had,'' he said.


Fisher voted against interest-rate cuts at the Jan. 30 and
March 18 meetings, and was joined in dissent by Philadelphia Fed
President Charles Plosser at the March meeting.

For related news:
Weak dollar: {STNI DOLLARLOW }
*T

HOT.

As in HOT AS inflation.

I am willing to bet next months read on CPI and PPI coming in pretty high, and probably higher than anyone would have imagined. And the Fed may have advance data on that, already.

Traders are realizing the Fed is internally worried, and probably not as divided at all, when they see where prices are heading and the risk that it is spiralling out of control despite falling demand, and what that will do to growth (GDP).

Well, I come from a family that operates buses and ferry in somewhat of a large scale (fleet) and I can tell you that $80 oil was about the time when profit margin is zero without a) accounting tricks and b) optimization (i.e. layoffs, operation curtailment/combining passengers in busses/fleet when they're not full, etc.)

The real economy is withering at the level of raw materials, without any ability to pass on the cost because the demand for finished goods are down. Just my two cents.
Here's what they think out there.


Monday, April 21, 2008

Three indices doing Air-walk.


For example:


  • S&P500 earnings is so far on track for $63.22, reflecting a P/E of 21.96. What's "priced in" is the 47% growth to be at $93.41 earnings by next year. Nasdaq is about as "aggresive" as ever.
  • The Dow is even more amazing, with forecast at 4x this year's earnings, at $900 versus currently running at $186.


Since I work in a Fortune 500 company and we are actively downsizing (management target is 20-30% employees out by this year alone), I am wondering how likely at 50% earnings growth is to be accomplished by 30% scale down in capacity. Not to mention the other problems concerning debt cost margin 3x that of last year and the obvious issue with dilution, or if trying to issue stock at this point in time.

Perhaps this is the DISASTER that they were PRICING IN? :)

State and Local Govt will create a tremendous drag.

Look at these charts, and understand that absent the ability to "print" there's not a whole lot of "good" you can expect out of the local and state government going forward.


Only IF they can piggy back Ben's fed window "printing" then this issue would disappear. (Of course only to be replaced with a MUCH bigger issue at the federal level )


Sunday, April 20, 2008

Analysis of the 20/50 weekly moving average Indicator

The article I am about to write is about forecasting/trend spotting using the indicator, after of course, the preliminary analysis to show that it's predictive long term ability is excellent (nearly flawless).

This particular indicator says:

  • Long-term Buy signal if: 20-weekly moving average on the Index goes up OVER the 50-weekly moving average by 1% from UNDERNEATH.
  • Long-term Sell signal if: 20-weekly moving average on the index goes down UNDER the 50-weekly moving average by 1% from OVERHEAD.

My skepticism was initially great against filter created of existing/past prices but that quickly went away after I analyzed that this filter hasn't generated a single false signal in the last 40 years. Study carefully the chart below for the SPX index from 1990 to Present time:


The white circles with Buy/Sell signals tracked the point at which the indicator generated a long term buy/sell signal. As you can see it is hardly disappointing. If you had followed this simple strategy, over the past 30 years, you would have outperformed the S&P500 index by 400%. ( Or more if you had choices of different asset class other than SPX. Like Sell the SPX in 2000 and buy real estate in FL instead :D )

Anyway, time for prediction. A question may arise at this point: Why, am I, the fundamentalist and earnings calculator, use techincal indicator as a prediction tool?

Prediction doesn't have anything to do with actual economic reality or earnings. If people started buying again for whatever reason, thinking that not-paying debt is NO PROBLEM. That they can party TWO more years with negative or ever decreasing earnings from here on, then trend-analysis is your friend. And I try pick the most reliable friend, the 20-50 Weekly moving average indicator.

  1. Look at the RED box and you understand what I mean. The 20-weekly moving average, contrary to your instinct, cannot catch up the 50-weekly from underneath by having a couple of days of massive rally.
  2. Quite the contrary, the way to get there is meandering with violent whipsaw of 10% up and 10% down for nearly half a year or more, with the final cycle being the big "DOWN", and the Buy signal would have been generated from the indicator.
  3. This is a feature of any lagging filter. The 50-week average is lagging the 20-week. You first need to stabilize the market at some level, say 1300-1400. And then violent whipsaws - typically down - enough to force the 50-week "catches" the 20-week.

To hell with realities right? Well, I haven't degenerated quite that badly.

At this point there is a glaring inconsistencies in the RED box comparison, in the sense that we are WAY up to the previous RED box in both price but NOT earnings. The fuel is spent back in 2000-2001 for earnings. So where will earnings need to come from? Selling to foreign country will be limited to infrastructures, and if attempted will be simply grabbing LOW HANGING fruit. Since I don't have the answer to this question, I will leave it to your imagination/analysis.

Time will prove that either I am right that the Long-term trend is down, or for some absurd reason it's not about earnings anymore as much as it is pride of ownership "society" when buying stocks and the Long-term trend is actually up.

But what is without a doubt from all the realm of possibilities that I have discussed here, that in the short run (6-months),
  • Buying short term call and put would be disastrous.
  • Selling long term puts is risky at best.
  • Opening a stock position long is still unnecessary given you aren't giving back a whole lot if the indicator is somehow false at this point. And by implication, opening a short stock position other than current positions.

Beware of big 10-15% whipsaws in the coming weeks.


(Credit to Denninger at TickerForum who alerted me first of this indicator, which he said he got from a "grizzled" old trader at CBOE way back.)

Friday, April 18, 2008

Free TOUR inside Ambac and MBIA portfolios

The purpose of this tour is to see how much MONEY does Ambac and MBIA make by investing in a "Super Senior AAA" CDO, which is backed by a BBB subprime bond (well it was BBB two years ago before turning to CCC three months ago).

I picked one of the ABX BBB- 2006-2 bond from the venerable issuer Goldman Sach. Yes, the GSAMP 2006-HE3 series, bond M9.

Using software built to analyze such bonds under different assumptions of refinancing speeds (CPR), the default rate (CDR), and a severity of 40% (upon default the mortgage loans has 40% deficiency - common assumptions for subprime loans), here are the result:


The number in the intersection, -5,553, is the amount of spread in basis points over Libor, which will be realized assuming 18% default rate and 15% annual refinancing rate, which I deduced is more than very lenient, given how the collateral is performing as described in the other graph (Bankrupt, REO, and Foreclosure as of March is already 22%+, not including the delinquency rate - as noted in the second picture).


Yes, as in -55% under Libor (which is like 2.7%). That is a yield of roughly -50% a year.
This great investment, will wipe out 50% of a fully funded investment ($100 per par) of the AAA CDO within a year.
If however, the investors in question leveraged up (say 5-10x) and only has 10% of the notional value in reserve, you can clearly see how we can arrive at
  • An ENTIRE LOSS of equity
  • PLUS Debt loss the size of 4x the equity
within ONE YEAR of Investment. (which I think was in 2006 and 2007)
That is, ladies and gentlemen, the TRUE state of Balance Sheet in Ambac and MBIA.
I hope you enjoy your tour today.

This week's deep reflection

Could this be it? Could we have bought 2 more years of life, just like the Romans bought time from Alaric a few thousand years ago? Did we succesfully negotiate a phyrric victory, buy a few farming seasons before our women and children gets carted off by barbarians?

Don't kid ourselves. Things are absolutely beyond repair. The income gap is humongous. The tax rate will go up parabolically. Then the small matter of bank insolvency and forever loss of credit. Skyrocketing fuel cost will do wonder to operating incomes of industry. Add also the Chinese people we counted to "decouple" and "save" us are in fact our workers who are having problems to feed themselves lately. We are the ones who are supposed to be buying and paying them with worthless credit paper.

Yet, as demonstrable in OUR nation ability to "deny" reality and willingness to incur so much cost for so short-sighted of benefits, we managed to continue pursue unchecked spending and reclessly investing our wealths into a bankrupt system called the stock market.

All the circular reasoning thus far does not even satisfy the rule of additivity in math. By that I mean the problem is as obvious as One Plus One. But the answer so far is the letter "F", not even a numeric.

I do believe the problem is without REAL solution. Only IMAGINARY ones. In fact the analogy is perfect because the particular solution for this problem is the one with BIGGER and BIGGER amplitude, characterizing instability.

Perhaps so. Perhaps not.

It doesn't matter. I have enough from the past two years of investing, and I am ready to SIGN UP with the Roman Army, the Pigmen Baron, for two more years of salary and bonuses. If Alaric shows up today, I already have my covered wagon ready in the city harbor; If he comes two years from now, I will have TWO covered wagons instead.

Thursday, April 17, 2008

Finished reading the Asset Level classification yet?

After

  1. thinking very hard
  2. looking at the flow of information on the trading desk daily
  3. and reading prospectuses, trade docs, and even annual reports (10Ks)

I believe:

  • LEH has entirely Alt-A mortgage loans in its Level 3 Assets.
  • GS has a LOT of unsold ABS CDOs in its Level 3 Assets.
  • MS has a bit of everything with Subprime and Alt-A being larger than the rest.
  • C has a LOT of ABS CDOs and unsold LBO loans.

Of the four, I think if I deduced correctly, GS is in the worst predicament of all. Despite the NEVER ENDING HYPE.

Wall St. is indeed first and foremost a marketing machine with few other qualifications.

Primer on Asset Classification

Today I just want to post a note to clarify the often cited "Level 3" valuation. I would like to share with you examples of what is commonly classified as Level 3 assets (a LOT of things can qualify), and what to do to value them upon classifying them as Level 3 asset (very LITTLE).

======================

Figure 1. Definitions & Concepts — FAS 157
Notes on Fair Value Measurements

Fair Value Heirarchy

Inputs to Valuation Techniques

Level 1 inputs

unadjusted quoted prices in active markets for identical assets or liabilities

Level 2 inputs

  • inputs other than quoted prices included within Level 1 that are observable either directly or indirectly (examples include quoted prices for similar assets; prices in markets that have few transactions)
  • inputs other than quoted prices that are observable

Level 3 inputs

  • unobservable inputs shall be used to measure fair value to the extent that observable inputs are not available, thereby allowing for situations in which there is little, if any, market activity for the asset at the measurement date
  • unobservable inputs shall be developed based on the best information available, which might include the reporting entity's own data
  • however the reporting entity must not ignore information about market participant assumptions that is reasonable available without undue cost and effort (THE MOST IMPORTANT INPUT IS NO-INPUT, FAS 157 SAYS)


Examples of Possible Classification of Assets:

Level 1

  • Treasury and Agency debt securities
  • TBA pass-throughs (in active market)

Level 2

  • plain vanilla interest rate swap
  • Exchange-traded derivatives swaptions
  • Agency CMOs

Level 3

  • Long-dated currency swap
  • ABS CDOs
  • Alt-A fixed A-rated MBS

*NOTE: There is no set standard for classification, and management has extensive discretion.

There is also frequent migration (particularly between Levels 2 and 3 assets) from one reporting period to the next, depending on market conditions - adjustments to Level 2 inputs that are asset specific that is significant to the fair value measurement in its entirety might render the measurement a Level 3 measurement.

Wednesday, April 16, 2008

Watch that grocery bill, Joe.

I was very disturbed to read this, and read it several times today I did, and found myself restless into the end of my work day.

So I want to write it out and perhaps I learn something.

The complete article is at the bottom of this post, but here's what's so scary about the news:

The new price for China is $576 a ton, which was raised by $400 a metric ton (it was $176). A threefold increase.

Okay, why are the Chinese so desperate?

China is among countries that are becoming more reliant on fertilizers to boost crop yields as the availability of arable land shrinks and populations grow.

What about future potash purchases, will they still be on the short end of the stick?

``China will be kept on a short leash by producers that are keen not to allow for a possible restocking,'' Stiskin said. ``This shows that even China as the biggest net importer has had zero negotiation power'' with potash producers, Deutsche Bank AG said in a note to clients today.

Okay, this is the "mark-to-market" on potash, which will be the new market price for everyone, including food exporter (like USA), whose demand on potash wouldn't cause such an immediate term shortage the way China and India did.

But the US is going to pay that same price for potash. And does this mean food prices will triple very shortly from here on?

Maybe not. It may Quintuple instead.

The supply shortage may help the soil nutrient reach $1,000 a ton ``rather fast,'' Oleg Petrov, Uralkali's head of sales, said April 14.

Is that NOT a recipe for disaster, no pun intended? What - civil war in China IMPOSSIBLE? What about $1,000 a week grocery bill for family of four in the US - that is absurd, right?

The truth of the matter is, there is far more concern on my part about the continuity of economy or society in general than trading stocks related to the Ag-spec.

You've seen how otherwise non-supply constrained country faces an artificial constraint because a famine is unfolding in China.

The Chinese were dumb enough to slave for twenty years, destroy their ecosystems, in return for a bunch of worthless paper IOUs from some irresponsible spending-addicted nation.

But what about us? Keep doing nothing about this and as usual, by the time the riots broke, again what did they say? Close the barn door after what?

Hope you enjoy your dinner. I sure will mine.


The complete news:
==============
Potash Producers Raise Chinese Prices to a Record (Update3)
By Yuriy Humber
April 16 (Bloomberg) --

Potash Corp. of Saskatchewan Inc., the world's largest maker of the crop nutrient, and Russia's OAO Uralkali raised prices for Chinese deliveries by $400 a metric ton to a record amid booming food demand.

Canadian trading company Canpotex Ltd., which markets potash on behalf of North American producers, agreed to the price increase with Chinese customers, Saskatoon, Saskatchewan-based Potash Corp. said today in a statement. Uralkali also said today in a statement it agreed to the gain.

China is among countries that are becoming more reliant on fertilizers to boost crop yields as the availability of arable land shrinks and populations grow. Global fertilizer demand is rising 5 percent a year, and there's a 1.2 million-ton potash production shortfall, Uralkali said last week. Potash, a form of potassium, protects crops from dryness and disease.

``This shows that even China as the biggest net importer has had zero negotiation power'' with potash producers, Deutsche Bank AG said in a note to clients today.
Uralkali depositary receipts rose 3.85 euros, or 7.6 percent, to close at 54.80 euros on the London Stock Exchange. Potash Corp. rose C$10.35, or 5.5 percent, to C$198.50 at 4:15 p.m. in Toronto trading. Other potash producers also climbed: K+S AG, Europe's largest potash producer, gained 3.6 percent in Frankfurt trading; Agrium Inc. rose 7.7 percent in New York.
Belarus Output

Canpotex Ltd., which represents Agrium and U.S. producer Mosaic Co. and Potash Corp., will supply Chinese importer Sinofert Holdings Ltd. with 1 million tons at the new price this year.
Belarusian Potash Co., which trades the mineral for Uralkali and Minsk-based producer Belaruskali, said today in an e-mailed statement it agreed the same price change and volume. It supplied 2.2 million tons to China in the first half of last year by Rail, Belarusian Potash said on its Web site.

The 2 million tons Canpotex and Belarusian Potash committed to China for the second half of this year is a significant reduction on last year's level, Mikhail Stiskin, an analyst with Troika Dialog in Moscow, said in a research note.

``China will be kept on a short leash by producers that are keen not to allow for a possible restocking,'' Stiskin said.
Exports to China by Canpotex and Belarusian Potash will resume in June after a three-month stoppage due to price negotiations. India signed a contract with the two trading companies, which market more than half the world's potash, last month at a record $625 a ton, including freight costs.

Freight Costs

The new price for China is $576 a ton, excluding freight costs, Plymouth, Minnesota-based Mosaic said today in a statement. The price will be $665, including delivery costs, according to JPMorgan Chase & Co. analysts including Jeffrey J. Zekauskas. Troika Dialog estimates $670.
The supply shortage may help the soil nutrient reach $1,000 a ton ``rather fast,'' Oleg Petrov, Uralkali's head of sales, said April 14. Petrov said spot prices in other markets including Latin America will follow the Chinese benchmark and approach $750, including freight costs, by June.

Monday, April 14, 2008

Earnings, Grashopper ...

Earnings, Earnings, Earnings.

Can a 9 P/E stock goes down big? YES.


9 times WHAT?


See this previous blog from last week

Fallacy in Investment Thesis (SEE FALLACY # 2)

I rest my case :) If however, you follow these goons advice and bought the stocks ...

By Brad Skillman
April 14 (Bloomberg) -- Crocs Inc., the maker of the
namesake colorful clogs, said it may post a first-quarter loss
and cut its annual earnings and sales forecasts as consumer
spending slowed.
Crocs tumbled 28 percent in late U.S. trading.
The shoemaker, based in Niwot, Colorado, said today that
it will close its Canadian manufacturing operations to reduce
expenses. Sluggish consumer spending has prompted retailers to
slow orders of Crocs shoes, hurting sales.
``The retail environment in the U.S. has become
increasingly challenging as consumer spending and traffic
levels have slowed,'' Chief Executive Officer Ron Snyder said
in a statement.
The shutdown of the Canadian facility will contribute to a
first-quarter loss of as much as 5 cents a share, Crocs said.
Revenue will be as low as $195 million for the quarter. The
company previously forecast profit of 46 cents a share on
revenue of $225 million.
Annual profit will be as much as $1.64 a share, Crocs
said. Sales will rise 15 to 20 percent, or to as much as $1.02
billion. Crocs previously forecast profit of $2.70 a share on
sales of $1.16 billion.
Crocs fell $5.04 to $12.75 at 5:21 p.m. in trading after
the Nasdaq Stock Market had closed. The shoemaker has fallen 52
percent this year.
--Editor: Michael Nol, Stefanie Batcho-Lino.
To contact the reporter on this story:
Brad Skillman in New York at +1-212-617-2763 or
bskillman1@bloomberg.net.

And back to financial armageddon

This is a chart of ABK. Exactly nine months ago I began nibbling shorts into this baby and its subsquent death spiral was spectacular. Sweet (and painful short squeezes) memories when I did my taxes this morning.
I took some excerpt from Warren Buffett discussions of the bond insurers, very concise and straightforward:

" I read a few prospectuses for residential-mortgage-backed securities - mortgages, thousands of mortgages backing them, and then those all tranched into maybe 30 slices. You create a CDO by taking one of the lower tranches of that one and 50 others like it. Now if you're going to understand that CDO, you've got 50-times-300 pages to read, it's 15,000.
If you take one of the lower tranches of the CDO and take 50 of those and create a CDO squared, you're now up to 750,000 pages to read to understand one security. I mean, it can't be done. When you start buying tranches of other instruments, nobody knows what the hell they're doing.
It's ridiculous.
And of course, you took a lower tranche of a mortgage-backed security and did 100 of those and thought you were diversifying risk. Hell, they're all subject to the same thing. I mean, it may be a little different whether they're in California or Nebraska, but the idea that this is uncorrelated risk and therefore you can take the CDO and call the top 50% of it super-senior - it isn't super-senior or anything.
It's a bunch of juniors all put together. And the juniors all correlate. "
Amen.


A Departure of Style ....

Today I am taking a break from Short ideas. I own a bunch of them and felt rather gratified by actions in DSL and FED today. May their bankrupt Option ARMs soul rest in peace.
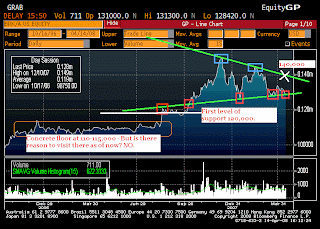
Think about going long for a second with a reasonable risk to the downside: I am watching BRK/A and seeing a triangle pattern forming, still pretty wide at this juncture making it somewhat irresistible to predict a leap from 128k to low 140k and observe by then whether a large volume shows up in the breakout. It looks also there may be disconnect between well performing stocks BRK owns (like JNJ, KO, BNI, even KMX or WU) with the somewhat dismal performance of BRK. Yes, there are the private equity as well, but I have been reading they are doing well.

Well, I am willing to bet just 10 BRK/B @ 4278-4280 a share it makes 10% in the next few days, otherwise at $4000 I will think about adding again as it looks like a decent support level there.
Enjoy:
I think a range of outcome between minus 5% to plus 10% is in the cards and I just like the "skew".

Friday, April 11, 2008

Typical Option ARMs from the bubble days.

I am not going to use anecdotes, he says she said, or quoting anyone.

Without further delay, I am presenting Countrywide's CWHL 2006-OA5 Package. These are your standard Option ARM loan packages, not much worse nor better from anyone else's.


Some explanations on the highlighted points:

  1. Only 52.9% of the balance remained after 2 years. But the trend is absolutely alarming, because it appears that RIGHT AFTER the FIRST year, everyone who could get out got out of this loan program. ( Probably about 30% of the population, and from what I heard they yet refinanced into another OA loan in 2007. It is sufficient to say they did NOT escape the "Event Horizon" ). All loan balance reduction since then has been involuntary (default).
  2. Obviously the change in serious delinquency itself can nearly explain all of the declining performing balance in the package.
  3. CA loans (and FL) dominated Option ARMs loan packages, twice or three times more prevalent sometimes even compared to subprime ARMs.
  4. This loan hasn't reset in any meaningful way. The recast is still 11 months away on average.
  5. The coupon is 1.63% and yet the WAC (think of it as APR) is 8.25%. More than 6.5% built-in Negative Amortization in this package, annually. Think also how much the Loan-to-Value ratio changed over the past two years factoring in California house price declines. I am 100% certain ALL the remaining loans are upside down, with LTV above 100%.
  6. It says here that 95.66% of the loan has negatively amortized. That means 95.66% of the borrower at some point (or rather, has been) choosing the "minimum payment" feature of the loan.
Everybody in the mortgage business (WM, WFC, BAC, IMB, DSL, FED) and the investment banks (C, GS, LEH, MER) all have unsaleable packages with identical level of toxicity.

Also, if any of you out there read this and recalled the "banking generational buy" from Dick Bove a couple of weeks back and would like to send him a link of this analysis, you have my blessing. He doesn't seem to have, in my opionion, a Bloomberg terminal, to even just look at the reality of those much vaunted Wall St. Bank balance sheets. It's really out there to see in plain sight.

Too damn bad there are people who listened to him.

Happy Anniversary OOMLT 2007-2!!!!

Or really just the Option One April 2007 Subprime deal from H&R Block.

This is how the deal is performing as of March 2008: 25% serious delinquency with 13.5% in foreclosure after a year. Teaser Freezer wont help 'em, they haven't even reset.

Look at the remaining balance: 85%. This is roughly 100% minus the 13.5% already in foreclosure, isn't it? Refinancing by FHA my a**.

The entire 2007 was LOCKED up as far as subprime non-agency financing went. So who own the risk in this package. Well maybe the AAA did catch a bid, but who owned the subs and NIMs because they're on the hook to pay losses?


So how much in 2006 and 2007 was Option One subprime production per OOMLT mortgage shelf outlet:

Yep, $16 Billion.
Where did this subprime RISK go? Keep in mind I shouldn't say RISK, but more like REALIZED damage already, per the first graph I put out.
HRB balance sheet per their last 10-Q was $7.5B. Yet, IF HRB didn't (and I think they couldn't) sell the risk of the $16B 2006 and 2007 subprime exposure, they will be sitting on top of roughly :
30% loss rate x $16B balance = about $5B LOSS, at the time when the Shareholder Equity is $1.4B.
Yes, that qualifies as being INSOLVENT.

Thought process realignment on Consumer Confidence

Do you think we are worse, equal, or better off than 1990?

Think hard about what we did have and now don't, and vice versa. Also I suggest you find the % of consumer spending of GDP in 1990 and 2008. How that trend has changed, and particularly if your life also happened to change because of it.


US Consumer Sentiment Index 1989 - 2008.

I will not spoonfeed you with what I think. You either find the truth yourself or fall into the abyss with those who failed to see.

Playing with WORDS will not and cannot save you this time.

Thursday, April 10, 2008

History rhymes and echoes ...

Time for more practical, good old fashioned digging.

They say past pattern of crimes can be seen, in almost identical sequence, without any copycatting intention, if you just bother to look.

Study the silently eerie, but deafening similarities between WCI communities and FBN furnitures. Tell me you cannot see the casts, the circumstantial evidences, the conflicts between actors, and the red downward pointing arrow sign made of neon light blinking above the cacophony.

Fallacy in investments, ongoing series.

1. Too many bulls (bears) therefore market cannot go up (down) anymore.

False. Earnings is the key to stock prices. The systems are wired that way because everyone in the business goes to the same school(s).


2. Using reasonable growth projection and realistic discount rate, you can get the long term (within 1-5 years) prices of stock. Use the formula Earnings/(cost of capital - growth) for this purpose.

True and False at the same time. The statement is true, assuming your earnings start at the right number. Can Goldman sachs replace $10 or so earnings from M&A and mortgage/CDO business and $2 or so from the hedge funds trading clients so the earnings at time zero is $22? I bet YOU know the answer.


3. Ambac can writedown up to $15B of losses according to CEO, which is what Times Square (Ackman) hedgefund (and this result is also reproducible by several entities, including T2 partners) was able to estimate as losses from CDO investments.

False. Equity book value is closer to $7B as of LAST year. Let's say there hasn't been that much outflow of cash yet, then the CEO is also PLANNING to writedown $8B of borrowing, which is not his money. Try tell your neighbor you are planning to pawn his car and see his reaction.


4. Getting tax deduction from (undeductible) prior losses is a reason to buy stocks, like homebuilders.

False. To get this deduction you first need to LOSE money. Have you tried on purpose doing that when you are gambling or investing? Ding Ding Ding.


5. There is reason to believe a lot of "bad news" have been factored in homebuilder stocks.

False. How bad? As in liquidating several hundred thousand homes at the "theoretical" 2-3x income of the "marginal" homebuyers? And then growing again with inflation? Don't forget though to add your "tax deduction". You're gonna need it BAD. [Evil grin].


6. Credit card company serious delinquency (read: Capital One), is at low 4%. It is a) not gonna increase further, and b) manageable.

False AND False. Nuff said on a). And for b), have you thought that for every $1 balance delinquent there is an accompanying $2 fees tagged to that and counted as "Asset" by accounting? Ah. Your body language tells me you are not feeling well. [Evil grin]


7. History is on MY side. Every downturn always led to recovery.

Hahahahahahah. Tell me where the downturn ends or what condition is sufficient to end the downturn. Then think whether the leader of this country/state/city/village has the ability or the courage to do so.

Also there has been experiment in Japan in the last 20 years to define that state and that experiment, suffice to say, is still ongoing.


8. Nevertheless I have proven in the past "mini" downturn, 87, 91-92, 00-02, that I can pick "stalwart" with steady earnings.

Like Ford and GM? Or Lucent, ATT, Oracle, Cisco? Was it Microsoft? Or was it Fannie Mae? Would it be Monsanto going forward, or would you rather have Chipotle rule the world? Or would you picture yourself getting a nice suntan in the carrib while waiting First Solar's earnings to be just under 100 of its price? I am sorry if your feelings are hurt. Point is, you generally cannot. I work for Fortune 500 with one goal in mind, to get paid at the expense of shareholder. To the extent I own shares of the companies I work for, they are awarded for free loot, and I am counting on the mindset above to help me turn that into money I can use to go to caribean myself at your expense.

Okay, if you insist to go East and fight the bolsheviks, the least I could do is give this inspiring parting gift:


9. Being rich is enough.

False. You also need to be able to HIDE your assets and income from that asset. Hint: Think a year or two ahead and save yourself. Also, being rich is never enough. Living a healthy life is much better.

I'll return to this series periodically.